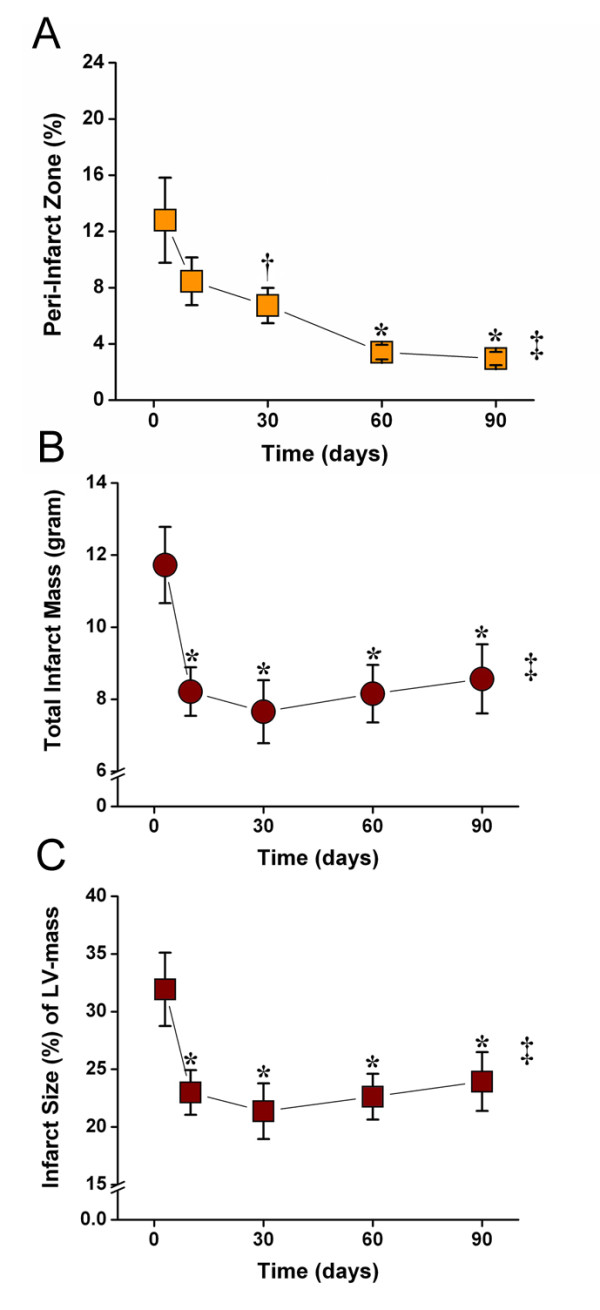
Figure 3.

LGE-CMR values of PIZ and infarct size remodeling. PIZ expressed as percent of total infarct size decreased until day 60, and only showed a minimal changes between day 60 and 90(* p < 0.01 versus day 3 post MI; † p < 0.05 versus day 3 post MI; repeated measures of ANOVA ‡ p < 0.001).(B) Absolute and (C) relative values of the infarct size show a continuous decline of infarct size until day 30. After 30 days the infarct mass and size increases until day 90 Consistent with infarct expansion (* p < 0.01 versus day 3 post MI; repeated measures of ANOVA ‡ p < 0.001).
