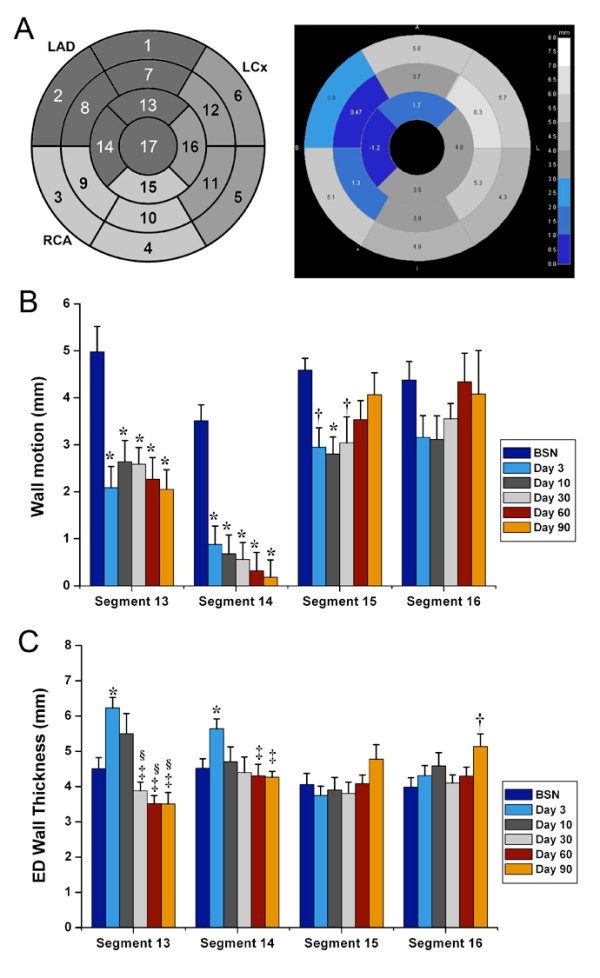
Figure 4.

Regional remodeling of the left ventricle after myocardial infarction. (A) Wall motion (ES-ED wall thickness) and endiastolic (ED) wall thickness of the whole left ventricle expressed in 17-segment model in relation to coronary artery supply. The polar plot on the right is an example of wall motion at 90 days post-MI. The reduced wall motion in the apical and mid-wall region in the LAD territory is revealed by the different shades of blue. (B) Wall motion in the apical segments decreases continuously during the 90 day follow-up in the infracted LAD territory (segment 13 and 14; * p < 0.01 versus baseline [BSN]; CMR acquisitions prior to MI), while it only decreases initially in the non-infarct related arteries (segment 15; * p < 0.01 versus BSN, † p < 0.05 versus BSN) and recovers during the follow-up (p = NS versus BSN). (C) ED wall thickness increase with post-MI edema in segments 13 and 14 (* p < 0.01 versus BSN) and decreases after edema has been absorbed (‡ p < 0.01 versus Day 3, § p < 0.05 versus Day 10). ED wall thickness of segment 16 at day 90 indicates compensatory hypertrophy of the remote, non-infarcted territory, to compensate for the thinning infarct scar († p < 0.05 versus BSN).
