
Figure 1.
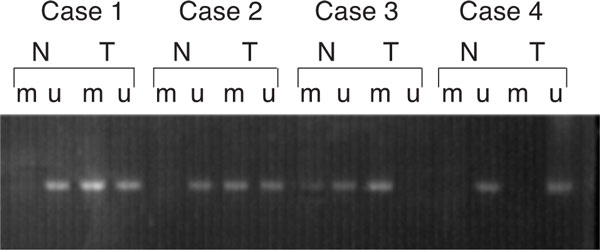
Methylation analysis of E-cadherin in tumor tissue (T) and corresponding normal tissue (N). u: indicates the presence of unmethylated genes; m: indicates the presence of methylated genes. Cases 1 and 2: tumor-specific methylation; Case 3: the tumor is fully methylated, whereas the corresponding normal tissue has a very faint band demonstrating methylation; Case 4: both of tumor and corresponding normal tissue unmethylated.