Figure 1.

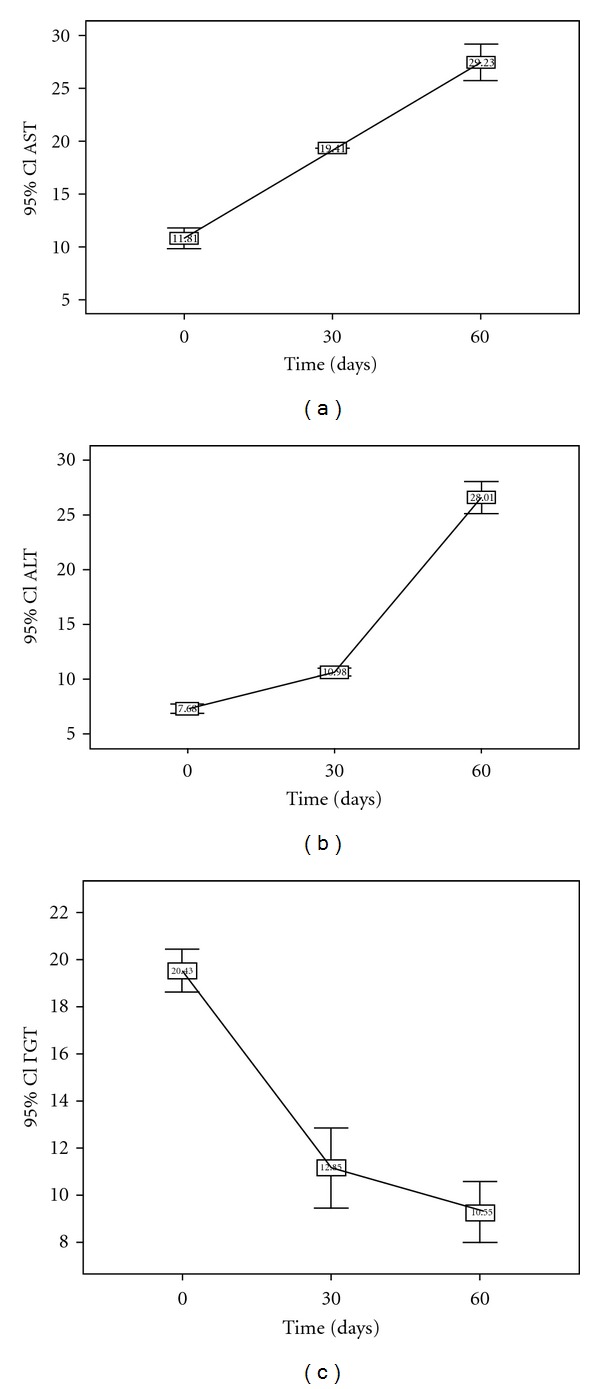
Variations of AST, ALT, and GGT during the two months of initial phase with their Bonferroni post hoc tests. *Day 0 versus day 30: P < 0.0001; day 0 versus day 60: P < 0.0001. *Day 30 versus day 60: P < 0.0001.

Variations of AST, ALT, and GGT during the two months of initial phase with their Bonferroni post hoc tests. *Day 0 versus day 30: P < 0.0001; day 0 versus day 60: P < 0.0001. *Day 30 versus day 60: P < 0.0001.