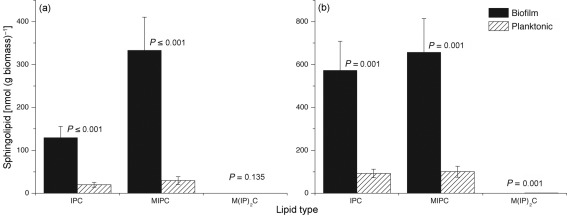
Fig. 3.
Distribution of sphingolipids in C. albicans biofilms and planktonic cells. Bars represent sphingolipid levels in biofilms and planktonic cells grown to (a) early phase (6 h) or (b) mature phase (48 h). IPC, inositolphosphorylceramide; MIPC, mannosylinositolphosphorylceramide; M(IP)2C, mannosyldiinositolphosphorylceramide. Data represent mean±se (n = 5).

