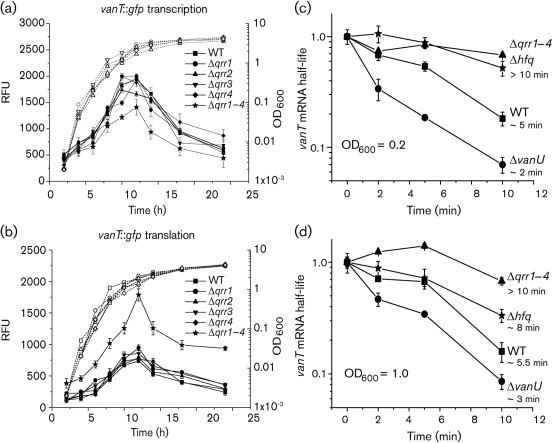
Fig. 6.
(a, b) Expression of vanT during growth of the wild type, and the Δqrr1, Δqrr2, Δqrr3, Δqrr4 and Δqrr1–4 mutants. The transcriptional (a) and translational (b) vanT : : gfp reporter gene fusions were expressed from the chromosome and were measured during growth of each strain. Growth (dotted lines) is indicated as OD600. At each time point, GFP-ASV expression (solid lines) was measured as fluorescence and presented as relative fluorescence units (RFU), which equals fluorescence units per 108 cells. (c, d) Stability of vanT mRNA in the wild-type and the Δqrr1–4, Δhfq and ΔvanU mutant strains. All strains were grown to OD600 0.2 (c) and 1.0 (d). At these time points, transcription was stopped by the addition of rifampicin (200 µg ml−1). Culture samples were taken at 0, 2, 5 and 10 min. The zero time point was withdrawn before rifampicin addition. Total RNA was isolated from each sample and qRT-PCR was done to determine the amount of vanT mRNA remaining at each time point. The mRNA levels at the zero time point for each sample were set at 1.0. The vanT mRNA was normalized to the 16S rRNA and each time point was normalized to the respective zero time point. The approximate half-life of the vanT mRNA in each strain is given as minutes on the right of each curve.

