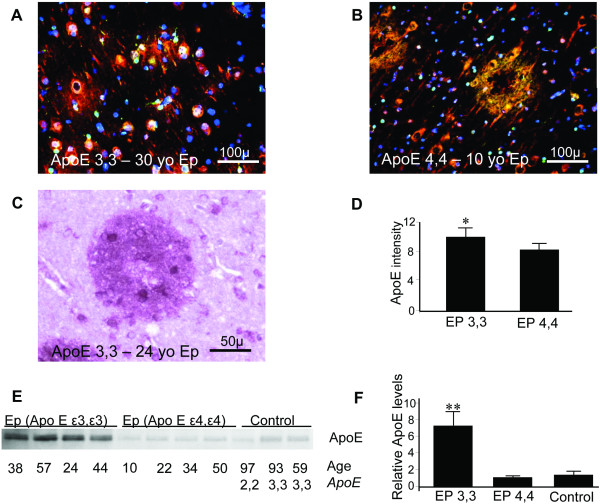
Figure 5.
ApoE tissue levels and Aβ plaques in epilepsy relative to APOE genotype Multiple Aβ (green) and ApoE (red) immunofluorescent plaques were present in 15 of the 52 APOE ε3,3 patients (colocalization of ApoE and Aβ is yellow). (A) Representative section from a 30-year-old APOE ε3,3 patient. (B) Representative section from the one of seven APOE ε4,4 patients who had Aβ plaques. (C) Both the shape and distribution to Aβ plaques were similar without regard to APOE genotype as shown in a 24-year-old APOE ε3,3 patient illustrated by light microscopy (ApoE immunoreactivity (brown); Aβ (magenta)). (D) ApoE immunofluorescent intensity was greater in tissue from those with APOE ε3,3 than in those with APOE ε4,4 genotype (APOE ε3,3 = 10 ± 1 vs APOE ε4,4 = 8.3 ± 0.8; P = 0.04). This difference in intensity was paralleled by increased relative tissue levels of ApoE (E) (APOE ε3,3 = 7.19 ± 1.75 vs APOE ε4,4 = 1.04 ± 0.06, and control = 1.27 ± 0.38; P < 0.001 for all comparisons) (F).

