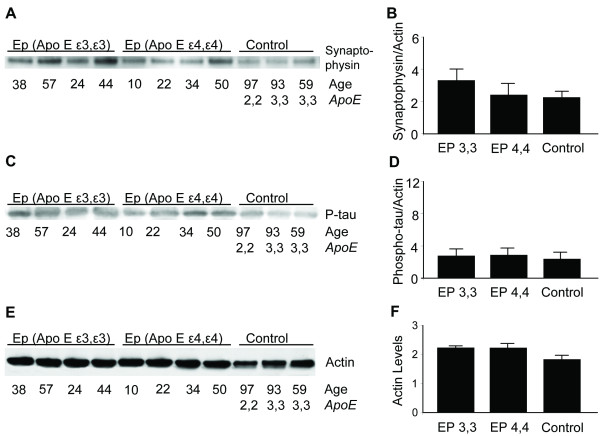
Figure 6.
Synaptophysin, phosphorylated tau and actin in epilepsy relative to APOE genotype An impression of similar synaptic densities in photomicrographs from each of the patient groups was confirmed by western blot analysis for the relative levels of synaptophysin compared to actin (APOE ε3,3 = 3.57 ± 0.76 vs APOE ε4,4 = 2.62 ± 0.8 vs controls = 2.41 ± 0.36; P = 0.11 for all comparisons) (A and B). Western blot analysis of phosphorylated tau (P-tau) (C) showed no differences with regard to genotype (D). Western blot analysis of actin (E) was used to assess specific protein levels of IL-1α, βAPP, ApoE, synaptophysin, and P-tau relative to actin. Actin expression was not different with regard to APOE genotype or levels of actin in tissue from controls (F).

