
Figure 3.
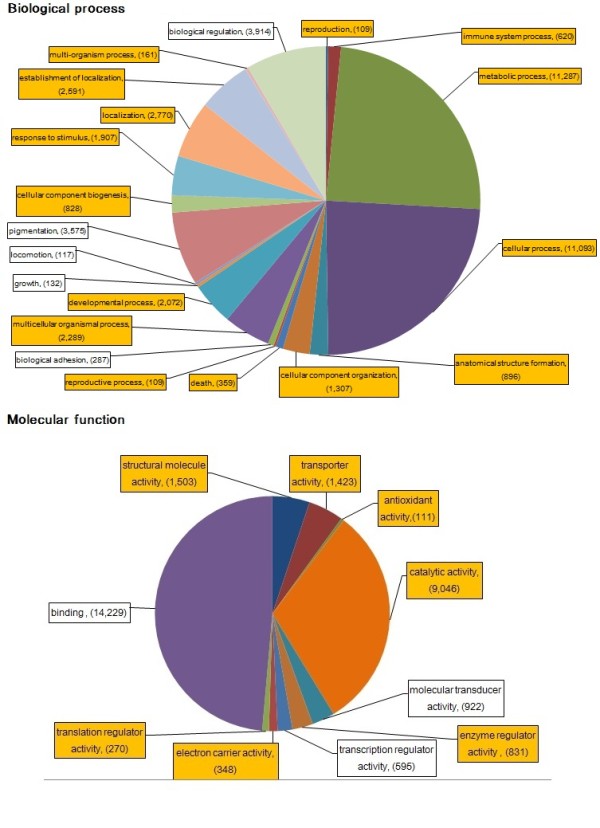
Distribution of common carp GO terms in biological process and molecular function categories. The relative proportion of GO terms is represented by more than 100 contigs for the biological process (A) and molecular function (B) categories in the GO vocabulary. The enriched GO terms in common carp (p < 0.05) were highlighted with orange.