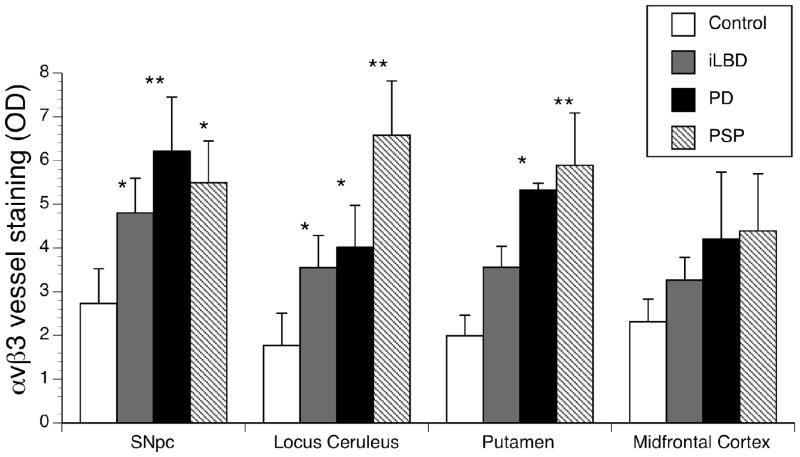
Fig 2. Intensity of αvβ3 staining in post-mortem human brain tissue samples.
Integrin αvβ3 immunoreactivity was quantified as optical density (OD) of the vessels (see Methods). Integrin αvβ3 immunoreactivity was significantly greater in all Parkinsonian conditions compared with controls in the SNpc, and locus ceruleus. In the putamen, only PD and PSP were different than control. In the Midfrontal Cortex, there was variability and none of the differences reached statistical significance. Data is expressed as Mean ± SEM. Statistical significance was determined for each area using ANOVA with Dunnett test for mean comparison to control with * (p<0.05) and ** (p<0.01).

