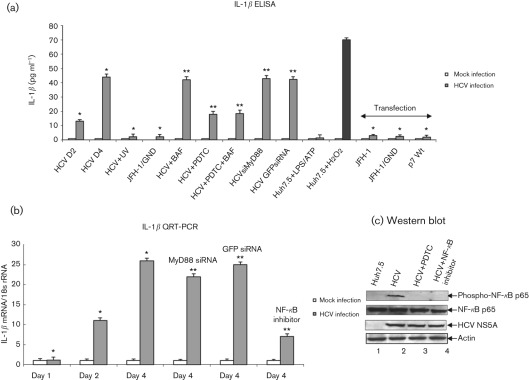
Fig. 1.
Activation of IL-1β by HCV. (a) Huh7.5 cells were incubated with HCV cell culture supernatant (m.o.i. of 1) for 6 h, and cultured for 2 and 4 days. Huh7.5 cells were incubated with UV-irradiated HCV, or supernatant from cells expressing JFH-1/GND for 6 h and cultured for 4 days. Huh7.5 cells were incubated with LPS (20 ng ml−1 for 6 h) followed by ATP (5 mM for 20 min) and H2O2 (500 µM for 20 min). HCV-infected cells at day 4 were incubated with BAF (20 nM for 12 h) and/or PDTC (100 µM for 6 h). HCV-infected cells were transfected with MyD88 siRNA or GFP siRNA for 4 days. Huh7.5 cells were also transfected with in vitro-transcribed JFH-1, JFH-1/GND RNA for 10 h, or plasmid expressing HCV p7 protein for 4 days. Cells were serum starved for 4 h, and cell culture supernatants were collected, centrifuged and subjected to IL-1β ELISA. The data shown here represent the means+sd of at least three independent experiments performed in triplicate. *, P<0.05 compared with mock-infected cells. **, P<0.05 compared with HCV-infected cells at day 4. (b) Induction of IL-1β mRNA by HCV. Huh7.5 cells were incubated with HCV cell culture supernatant as described above. HCV-infected cells were incubated with NF-κB inhibitor (20 µM for 6 h), PDTC (100 µM for 6 h) and transfected with MyD88 or GFP siRNA as described in Methods. Cells were serum starved for 4 h and total cellular RNA was extracted and subjected to cDNA synthesis. QRT-PCR was carried out using SYBR green master mix (ABI) and IL-1β-specific primer sets. 18s rRNA was used as an internal control. The values represent the means+sd of at least three independent experiments performed in triplicate. *, P<0.05 compared with mock-infected control cells. **, P<0.05 compared with HCV-infected cells at day 4. (c) Activation of NF-κB by HCV. Equal amounts of cellular lysates from Huh7.5, HCV-infected cells, and treated with PDTC or NF-κB inhibitor were Western blotted with indicated antibodies. Lanes 1 and 2, lysates from Huh7.5 cells and HCV-infected cells; lanes 3 and 4, HCV-infected cells treated with PDTC or NF-κB inhibitor, respectively. Bottom panels represent the expression of HCV NS5A and actin controls.

