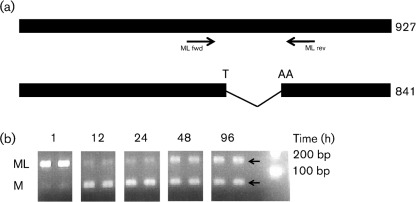
Fig. 3.
Transcripts of JOSV segment 6 modified by splicing. (a) Bars represent unspliced and spliced transcripts of segment 6. The black arrows show the position and orientation of PCR primers spanning the putative intron. (b) Time-course analysis of the expression of mRNA coding for JOSV ML and M (two biological replicates for each time point). Expected product size for ML and M transcript isoforms were 161 and 86 bp (arrows), respectively.

