Figure 3.

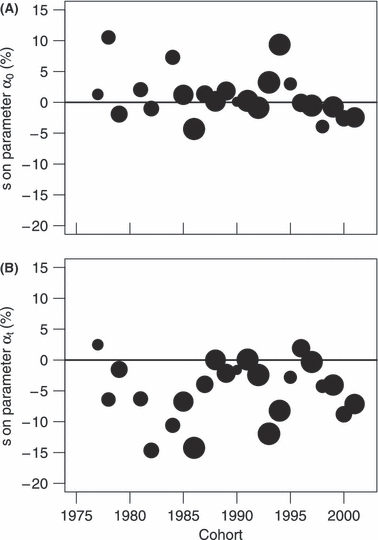
Selection differentials (s) estimated for each cohort. (A) s for length at age 1 (α0), and (B) s for logarithmic growth (αt). The width of the circle corresponds to the number of fish within each cohort.

Selection differentials (s) estimated for each cohort. (A) s for length at age 1 (α0), and (B) s for logarithmic growth (αt). The width of the circle corresponds to the number of fish within each cohort.