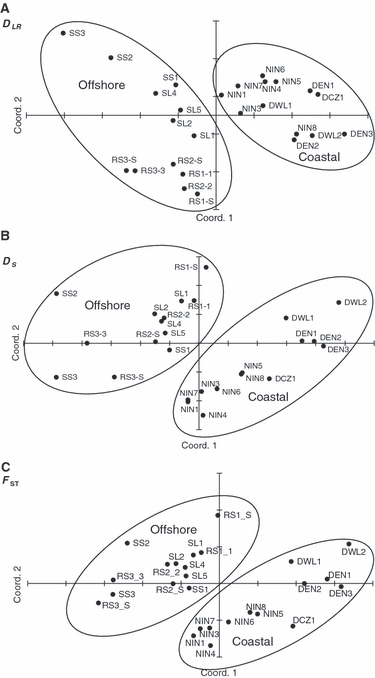
Figure 2.

Plots of Principal Coordinate Analysis calculated in GenAlEx v6 from standardised distance matrix derived from pairwise DLR (A), DS (B) and FST (C) estimates between Acropora tenuis sites in northwest Australia. Site names begin with the first letter of each system. The first two axes explain 71% of the variation for DLR, 82% for DS and 89% for FST.
