
Figure 3.
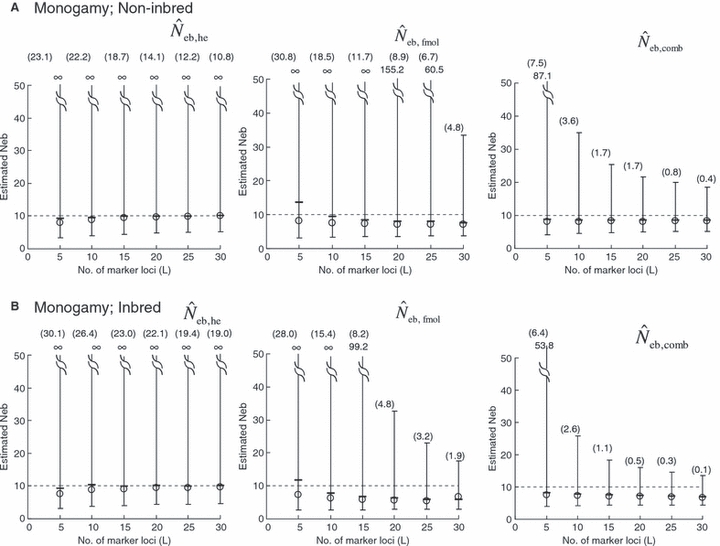
Harmonic mean (marked by open circle), and 10th, 50th and 90th percentiles (marked by bar) of 5000 estimated effective numbers of breeders in the (A) noninbred and (B) inbred populations under monogamy with N = 10 (half of each sex) parents, for the case of high-polymorphic marker loci. The sample size of progeny is n = 100.  is the estimate from heterozygote-excess method (Pudovkin et al. 1996),
  estimate from equation (7) and
  the estimate by harmonic mean of
  and
and  . The value in top of each graph is the clipped 90th percentile, and the value in parentheses is the percentage of replicates with
  . The dashed line shows the effective number of breeders expected from demographic parameters (Neb,demo = 10).