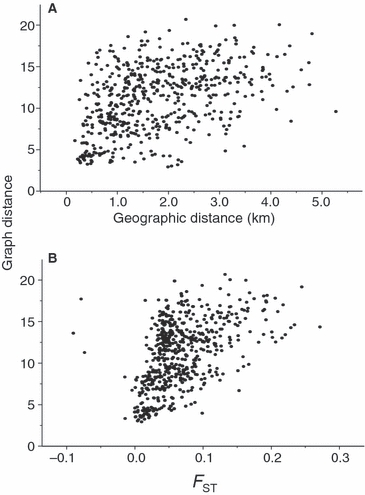
Figure 3.

(A) The relationship between graph distance (shortest distance between pairs of nodes) and geographic distance among 34 nodes demonstrating the detection of isolation by distance within the graph structure. (B) The relationship between graph distance and FST among 34 nodes. Fishers were sampled from 34 different landscapes (nodes) in and around ON, Canada during 2000–2003 and profiled at 16 microsatellite loci.
