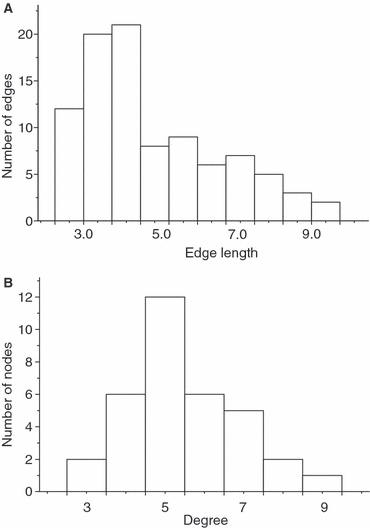
Figure 4.

Histograms of the distribution of (A) the distance weighted network edges (connections between nodes) representing the genetic distance between connected nodes on the graph; (B) the Poisson-distributed degree distribution of a fisher, Martes pennanti, gene flow network, consistent with a small-world network. Fishers were sampled from 34 different landscapes in and around ON, Canada during 2000–2003 and profiled at 16 microsatellite loci.
