
Figure 2.
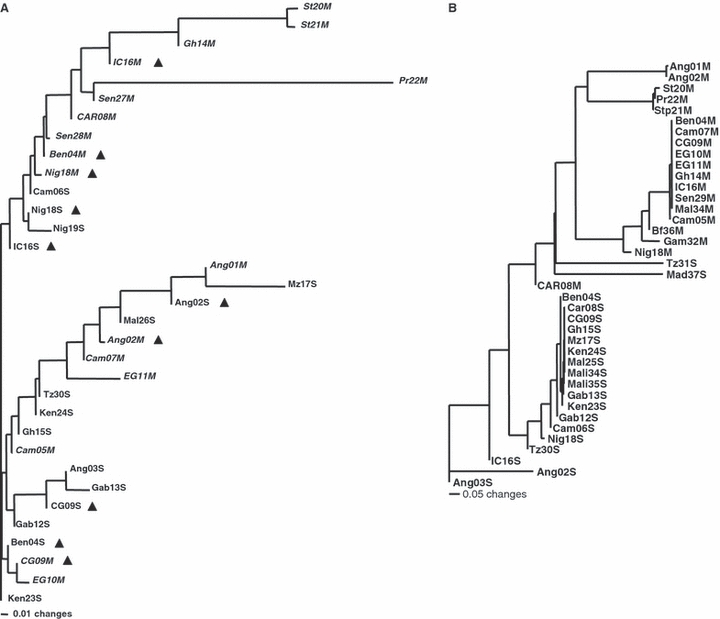
(A) Neighbor-joining tree based on pair-wise FST values between populations of Anopheles gambiae sensu stricto estimated using the ND5 mitochondrial gene. To better distinguish the M and S populations, M-form populations are written in italics. Triangles indicate populations that have been split into an S-form population and an M-form population. (B) Neighbor-joining tree based on pair-wise FST values between populations of Anopheles gambiae estimated using the ITS sequence data. NJ trees are not intended to infer phylogenetic relationships but rather to show clusters of FST values. Taxa are labeled as in Table 1.