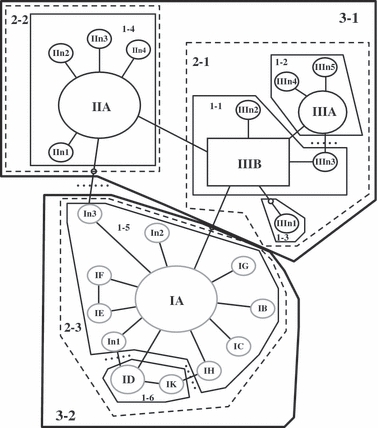
Figure 3.

tcs network for the ITS sequence data labeled following Gentile et al. 2002. Number of taxa = 781, number of haplotypes = 24. Haplotypes n1–n5 indicate new haplotypes. The black square and the ovals represent M molecular types; grey ovals are S molecular types. Haplotypes labeled II and III are M forms. Haplotypes labeled I are S forms. Small empty ovals represent missing haplotypes. The square haplotype (IIIB), representing the inferred ancestral haplotype, was found in populations St20 (frequency = 0.21), St21 (0.34), Pr22 (0.21), Ang01 (1.00), and Ang02 (0.97). Size of haplotype roughly corresponds to frequency. Lines separating symbols represent mutational steps or single base-pair substitutions. Dotted lines show where loops were broken. Haplotypes are nested into hierarchical clades in preparation for the NCA analysis. Thin lines group haplotypes clustered into one-step clades, dashed lines into two-step clades, and thick lines into three-step clades. Clades are labeled by clade level and hyplotype number, for example, 1-2 is the second haplotype in the one-step clade.
