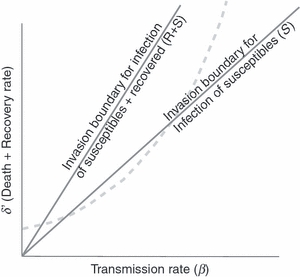
Figure 3.

A population with a high density of recovered hosts is susceptible to invasion by highly virulent mutants. Once a parasite has evolved close to its optimum along the trade-off boundary, there will be only a small set of mutants that can invade, because they are all subject to the same constraints, provided they can infect only the susceptible hosts; the invasion threshold for those mutants is a line of slope S (the rightmost line). A mutant capable of infecting both susceptible and recovered hosts will have a much larger set of possible mutants that can invade (the invasion threshold is a line of slope S+R, where R is the density of recovered hosts, hence lies to the left of the line of slope S) and thus have greater potential to evolve nonoptimal virulence. The graph is the same as in previous figures, except that the vertical axis (δ′) now includes the recovery rate of infected hosts as well as mortality rate (the δ in previous figures was just mortality rate).
