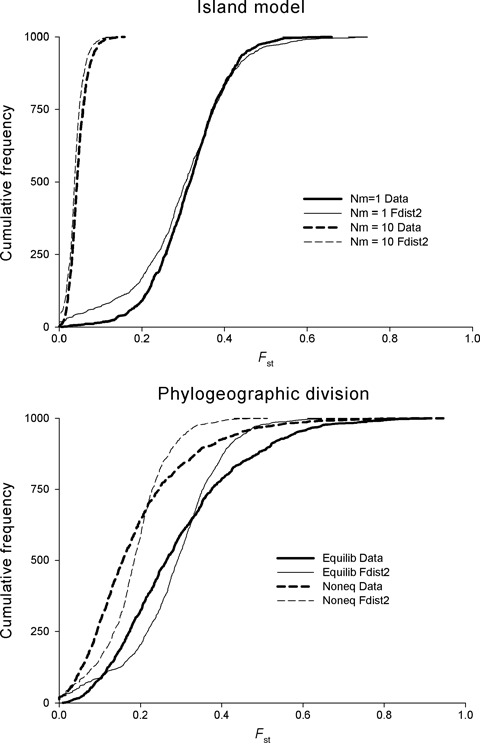
Figure 1.

An example of the difficulty in genetic inference. Cumulative frequency distribution of Fst for data simulated using Simcoal (Excoffier et al. 2000– heavy lines) and analysed using FDist2 (Beaumont and Balding 2004– thin lines). Top panel: Island model with 1 and 10 migrants per generation (solid and dashed lines respectively). Because the data were simulated with the island model, the distribution is well matched by FDist2. Bottom panel: Populations phylogeneticaly related within two lineages at migration/drift equilibrium (solid lines) and recently diverged (dashed lines) 5Ne generations ago. Departure from the Island model greatly increases the stochastic variability of the data relative to assumptions of the analysis. Data were simulated assuming 10 populations each with Ne = 10 000, and the infinite alleles model with μ = 0.5 × 10⁻⁶. The island model assumed equal migration among all populations, whereas the phylogenetically structured model assumed five populations within each lineage, with Nm = 1 among populations within each lineage and restricted (Nm = 0.001) migration between lineages.
