Figure 3.

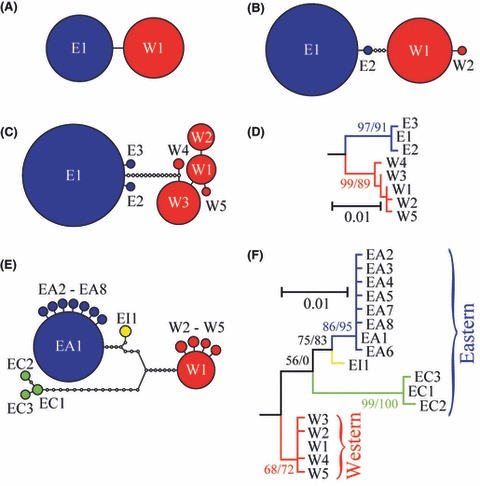
Haplotype relationships. Clade E is shown in blue and clade W in red for ATPase (A), Act (B), and RpS7 (C, D). For Cytb (E, F), clade W is in red, clade EA in blue, clade EC in green, and clade EI in yellow. The networks were constructed under the 95% maximum parsimony criterion, and the size of the circles is proportional to the haplotype frequency; small empty circles represent unobserved haplotypes. The maximum-likelihood phylograms are shown with bootstrap (from 1000 replicates)/aLRT support for major partitions in the RpS7 (D) and Cytb (F) phylogenies, with branch lengths proportional to the scale bar with the unit being a mean number of nucleotide changes per site.
