
Figure 3.
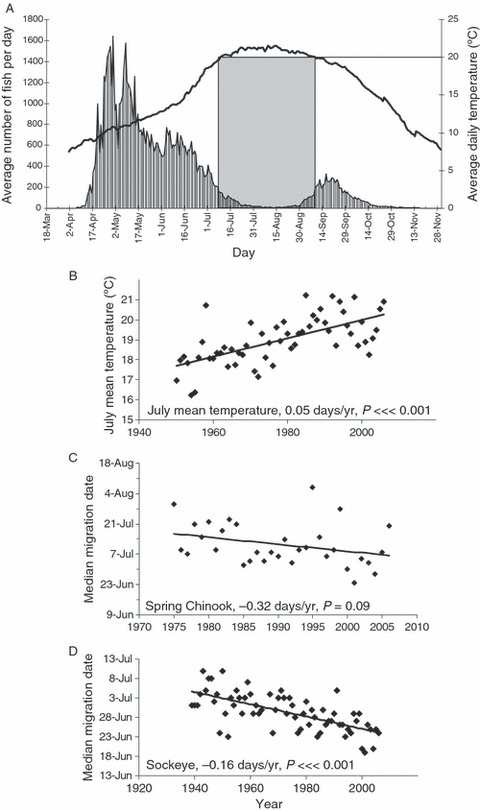
(A) Average daily Chinook salmon counts and temperatures at Lower Granite Dam from 1995 to 2006. The boxed area shows the average time period the river is over 20°C, reducing the migration of adults, as shown by the lower Chinook counts during this time period. (B) Mean July temperature at Bonneville Dam, with 1960–1979 temperatures inferred from measurements at McNary Dam. Median migration date of (C) spring Chinook and (D) sockeye salmon. Regression statistics and lines are shown. All data from DART 2007.