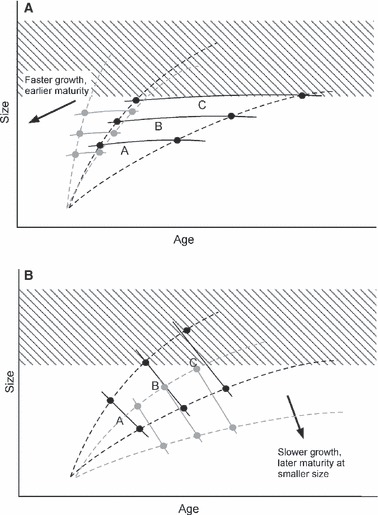
Figure 1.

Hypothetical maturation reaction norms for size and age at maturation in salmonids under variable opportunities for growth. The dotted black curves depict hypothetical growth trajectories, from rapid (steep) to slow (shallow). In the strictest sense, reaction norms reflect phenotypic differences among distinct genotypes, although such functions are often used to evaluate patterns in other genetically differentiated groups. Here, A, B, C refer to distinct genotypes, families, or populations, with their maturation reaction norms indicated by the three solid curves in each pane. Solid black dots indicate the intersections of the growth trajectories and reaction norms for each group. (A) Maturation reaction norms corresponding to a primary influence of size on first maturation (‘size-constrained maturation’). In this case the reaction norms are relatively flat, so that size selection imposed by fishing, indicated by the hatched area, is likely to increase growth rate and reduce size and age at first maturation in an exploited population. Possible responses in the reaction norms predicted by the arrow are given by the curves and dots in grey. This scenario appears consistent with the biology and phenotypic response of several species, such as Atlantic, Chinook, chum, and sockeye salmon, and steelhead and anadromous cutthroat trout (as well as some marine species such as cod and plaice). (B) Maturation reaction norms corresponding to a primary influence of age on first maturation (‘age-constrained maturation’). In this case the reaction norms are more vertical, so that size selection imposed by fishing is likely to reduce growth rate, and perhaps increase age and reduce size at first maturation, in an exploited population. Possible responses in the reaction norms predicted by the arrow are given by the curves and dots in grey. This scenario is consistent with the biology of species with a constrained age structure, such as pink or coho salmon.
