
Figure 2.
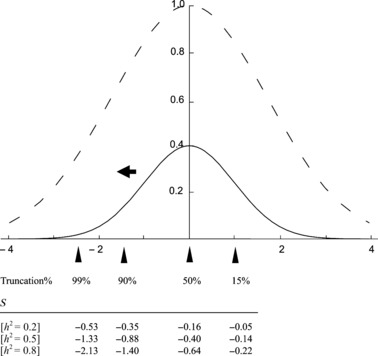
A quantitative genetic model of stabilizing selection after one generation of truncation due to domestication. The solid line represents phenotypic distribution of a quantitative trait at the equilibrium state under stabilizing selection (standard normal distribution), and the dotted line represents relative fitness of individuals with the corresponding trait values (x-axis) when ω2 = 2 (variance of the adaptive landscape: ω2 + 1 = 3. see Estes and Arnold 2007). Four different levels of truncation are considered and an arrowhead represents the truncation point (Truncation%) in each case such that all fish with trait values to the left of the arrows are viable. Selection differentials (S) after one generation of hatchery rearing and natural reproduction of hatchery fish are shown with three different levels of heritability (h2 = 0.2, 0.5, 0.8).