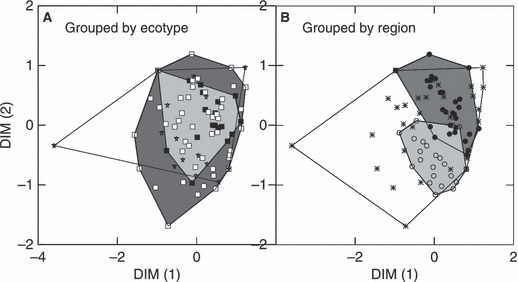
Figure 2.

Multi-dimensional scaling plot of Cavalli-Sforza and Edwards (1967) chord distance between all populations (84) with a sample size of at least 20. A - the convex hulls group populations of the same ecotype (solid squares – sea/river ecotype, open squares – lake ecotype; stars – kokanee ecotype); B – the convex hulls group populations of the same region (open circles – southern, asterisks – coastal, solid circles – northern).
