
Figure 5.
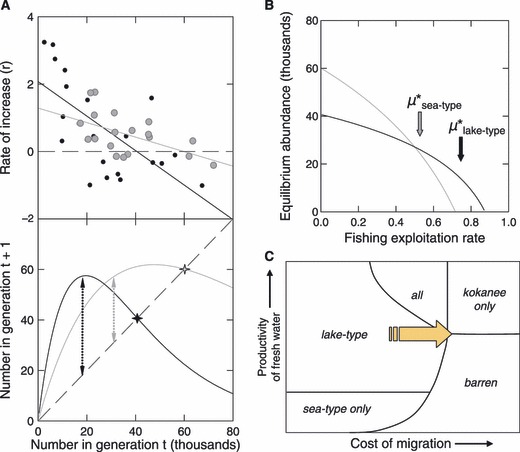
Comparison of productivity of the Tahltan lake-type (dots and darker lines) and mainstem Stikine sea/river-type (shaded circles and lighter lines) sockeye populations in the Stikine River. A – Ricker stock-recruitment curves (Ricker 1954) fitted to fisheries data showing intrinsic productivity (intercept in regression), maximum equilibrium abundance (crosses), and estimated maximum sustainable yield (vertical dotted arrows). The Ricker a parameter is 2.08 (se = 0.45) for the Tahltan (lake-type) population and 1.26 (se = 0.27) in the mainstem Stikine (sea/river-type) population. B – Equilibrium abundance as a function of sustained annual rate of fishing mortality for the Ricker curves fitted in Figure 5A; arrows indicate the exploitation rate (μ*) that would maximize sustainable yield for each ecotype. C – Schematic niche model showing the likely impact of intensive coastal fishing on the availability of habitat for sockeye ecotypes (modified from Wood 1995.)