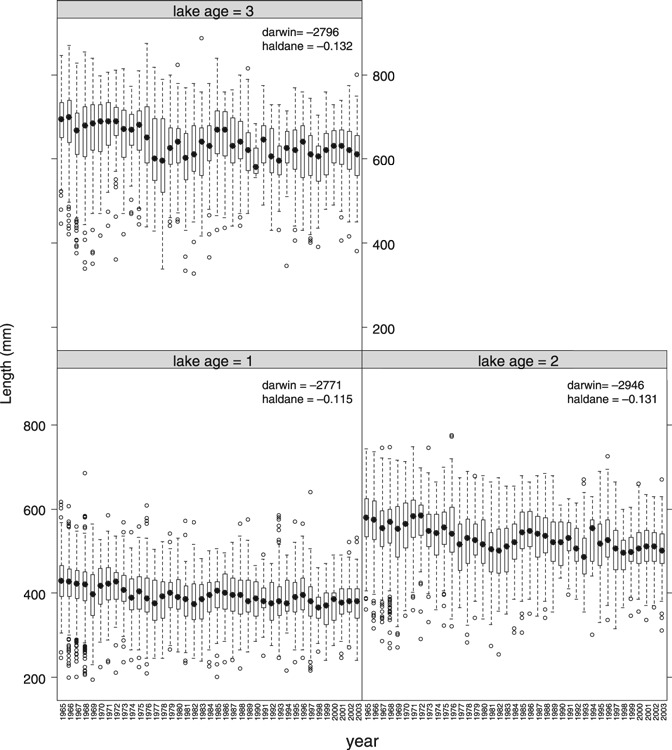
Figure 4.

Box plots of length (mm) at lake-ages 1–3. The corresponding linear rates of phenotypic change (darwin and haldane) are given for each trait (all P < 0.0001). The boxes cover 50% of the observations, the whiskers 90% of the observations and the large black dot symbol mark the median.
