
Figure 6.
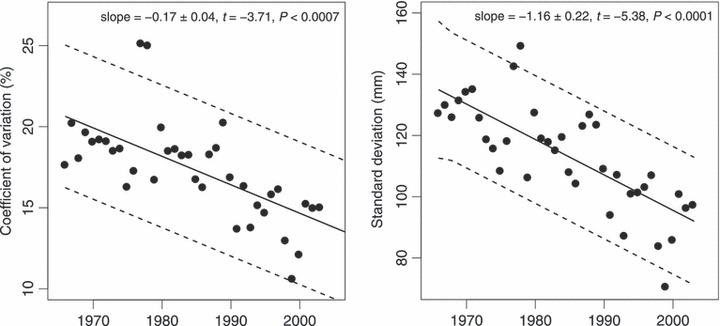
Temporal trend in the coefficient of variation (%) and standard deviation (mm) for mean annual length of mature fish caught in the Hunderfossen fish trap over the 1965–2003 period. The dotted lines correspond to autocorrelation-adjusted 95% confidence bounds, retrieved from the most AIC-supported autoregressive linear trend models (CVlength : PAR(1) = 0.032, stdlength : PAR(1)=0.054).