
Figure 8.
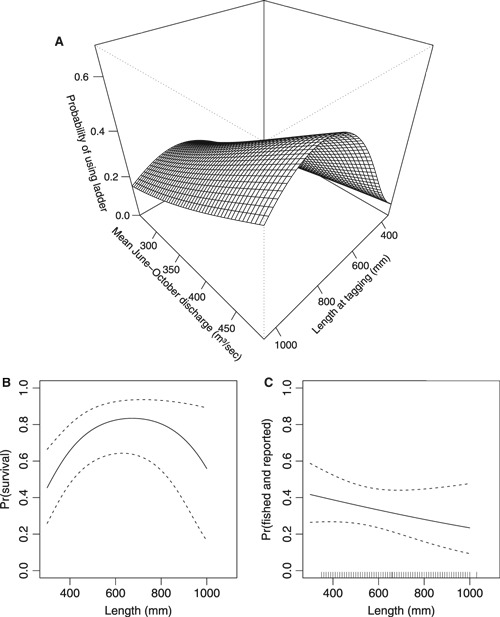
Estimated size-specific probability for (A) using the fish ladder (also includes the effect of water discharge and interaction effect of this variable with individual length), (B) surviving the first year in the lake following tagging, and (C) being caught in gillnets or by anglers in the lake. These predictions are based on the most supported Burnham model (model 1) in Supplementary Table S2. The inner tick marks in C indicate individual length observations (of which many are superimposed on each other). The A probabilities are adjusted for mean river water temperature of 11.2°C, and B probabilities are adjusted to a mean lake water temperature of 11.8°C and a mean total phosphorus level of 7.4 μg L−1.