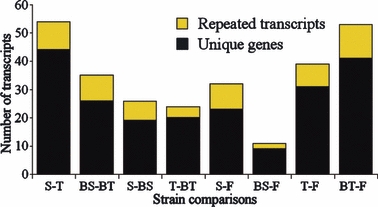
Figure 1.

Number of transcripts showing significantly different expression in pair-wise strain comparisons (contrast, maximum P-value of 0.01). The black portions of the bars show the number of unique significant genes, while the yellow portions represent the number of repeated transcripts from the unique genes. (S = Stewiacke, T = Tusket, F = Farm, BS = Backcross Stewiacke, BT = Backcross Tusket).
