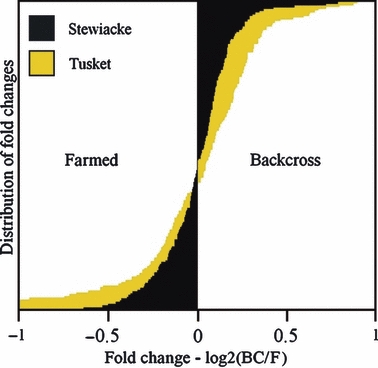
Figure 2.

Fold change distributions for Backcross-Stewiacke vs Farm (black) and Backcross-Tusket vs Farm (yellow). The x-axis represents the log2 of the backcross (BC) to Farm (F) ratio for each transcript, while the y-axis shows the distributions of fold-changes for the 177 candidate transcripts.
