
Figure 3.
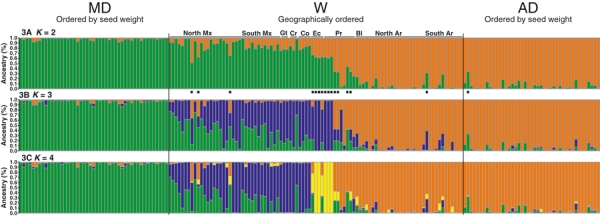
Population structure as inferred by structure v2.1; each individual is represented by a vertical line, partitioned into K coloured segments that represent the estimated membership of each individual. Black square indicates admixed genotypes at K = 2. Groups: MD, Mesoamerican domesticated; AD, Andean domesticated; W, Wild. Countries are abbreviated as follow: Ar, Argentina; Bl, Bolivia; Co, Colombia; Cr, Costa Rica; Ec, Ecuador; Gt, Guatemala; Mx, Mexico; Pr, Peru.