
Figure 6.
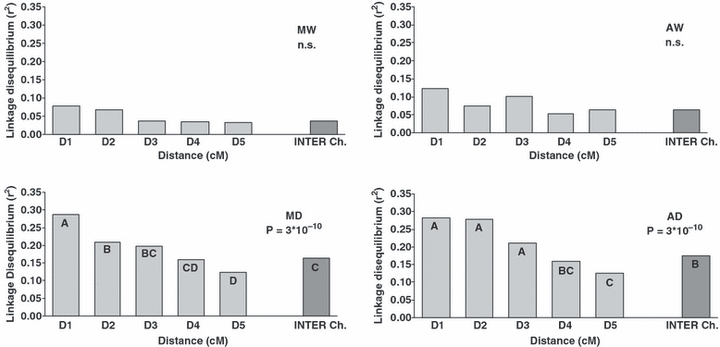
Analysis of LD (r2 plots) as a function of genetic distance (cM) for subgroups (MW, AW, MD and AD). Intra-chromosomal classes of distances (D1: ≤3; D2: >3 and ≤10; D3: >10 and ≤30; D4: >30 and ≤50; D5: >50), inter-chromosomal class of distance (Inter Ch.); different letters on the bar plots indicate differences among the recombination distance class; n.s., not significant.