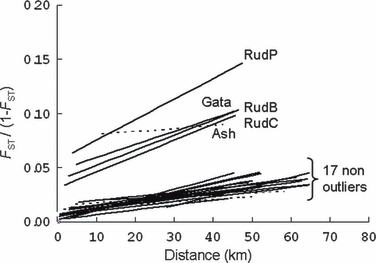
Figure 4.

Decomposed pairwise regression of genetic distance [FST/(1 − FST)] and geographic (km) distances for the 22 samples. Each of the five outlier samples was regressed with the 17 nonoutlier samples, whilst each of the 15 nonoutliers was regressed with the other 14 samples. Solid and dashed lines represent statistically significant or nonsignificant regressions respectively.
