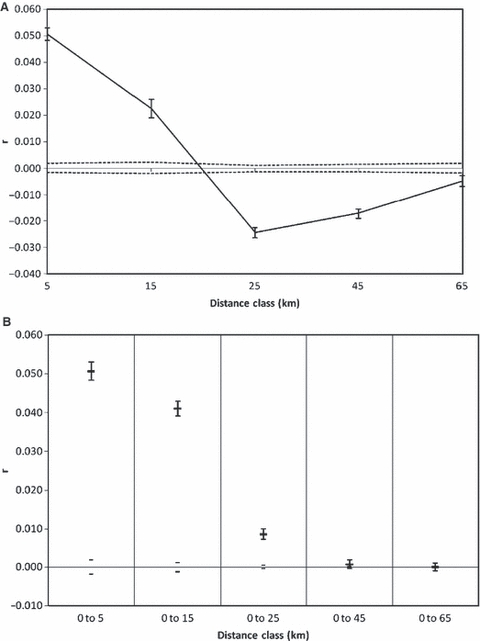
Figure 5.

Spatial autocorrelation analyses with samples isolated above barriers removed. (A) correlogram of the genetic correlation (r) as a function of distance. (B) The genetic correlation (r) as a function of increasing distance classes. Dotted lines (A) and grey bars (B) indicate the 95% confidence interval (CI) about the null hypothesis and error bars about r indicate the 95% CI.
