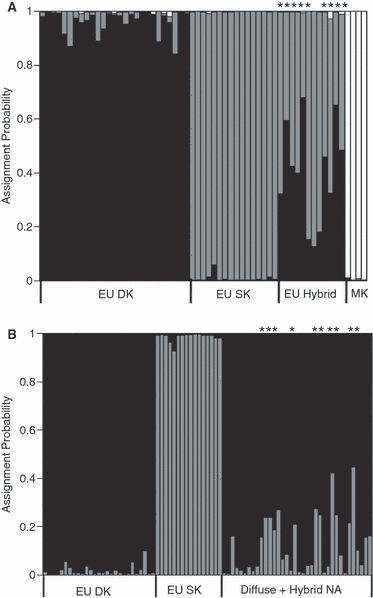
Figure 4.

Bayesian assignment probabilities with admixture and (A) K = 3 and (B) K = 2 [STRUCTURE v. 2.2; Pritchard et al. (2000); Falush et al. (2007)]. Each vertical bar represents one individual. The black, grey, and white coloring represents the posterior mean proportion of ancestry from diffuse knapweed (2n), spotted knapweed (2n), and in (A) meadow knapweed, respectively. *population of origin genome probability does not include one, indicating hybridization. EU, Europe; NA, North America; EU hybrid, individuals from spotted × diffuse hybrid swarms in the Ukraine; MK, meadow knapweed (out-group). Based on morphology, diffuse and hybrid-like plants were included in approximately equal numbers from North America sites (see text).
