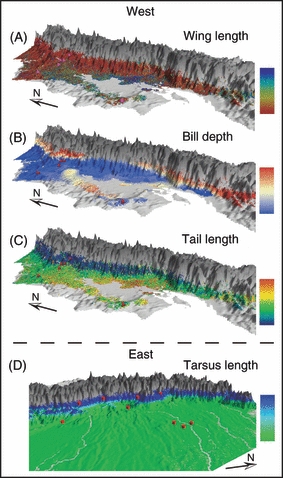
Figure 2.

Predicted patterns of morphological variation in the wedge-billed woodcreeper for separate generalized dissimilarity modeling analyses of: (A) wing length; (B) bill depth; (C) tail length; (D) tarsus length. Gray indicates areas where the species is not present. Pairwise comparisons of colors between any two sites in the landscape indicate morphological differences, where large color differences (see bars) represent large morphological differences. Blue (A) and red (B–D) dots indicate sampling localities. See also Fig. S8.
