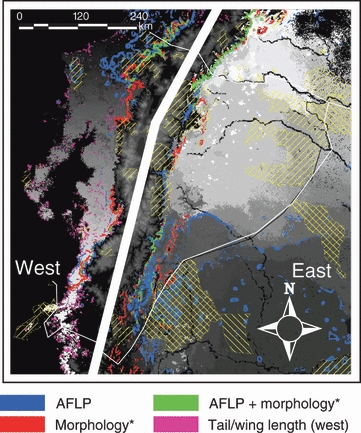
Figure 3.

Synthesis of results, showing areas that harbor particularly high levels of turnover of phenotypic and genetic variation (colored regions: area with highest 10% rates of change). The gray scale indicates classes of unique variation that does not occur anywhere else. Because of large population divergence between the west and east of the Andes, colors and gray scales can only be compared within each region. Hatched areas indicate currently protected areas (World Database on Protected Areas). Morphology east of the Andes is represented by tarsus length, and west of the Andes by bill depth. Tail and wing length west of the Andes are indicated separately in green, but show a much diffuser pattern because of the importance of treecover in explaining the variation, and the high level of disturbance in that area. Areas where model confidence was low because they fell outside the environmental space sampled were omitted from this map.
