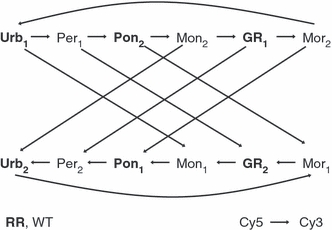
Figure 2.

Interwoven loop design of microarray experiment. Each arrow represents one array, where the base of the arrow represents the sample with Cy5 label and the head of the arrow represents the sample with the Cy3 label. Biological (and extraction) replication is represented by subscripts; rotation-resistant populations are in bold. Population are as follows: Urb, Urbana; Per, Perry; Pon, Pontiac; Mon, Monmouth; GR, Grand Ridge; Mor, Morrison.
