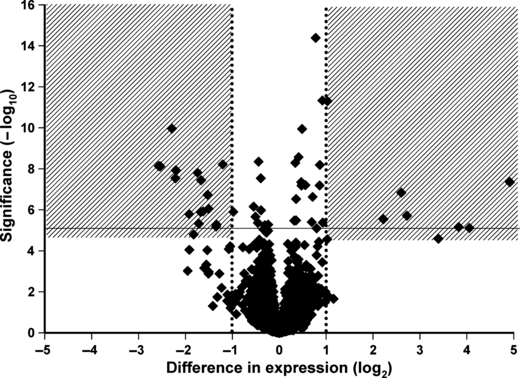
Figure 3.

Volcano plot of results from microarray experiment. Each point represents the output from the analysis of variance conducted on each expressed sequence tag (EST). The x-axis is the estimated difference in expression measured in log2; vertical dotted lines refer to a twofold difference in expression between the two behavioral types. Genes more highly expressed in rotation-resistant populations are on the right; genes more highly expressed in wild-type populations are on the left. The y-axis is the significance of the difference measured in −log10 of the P-value; the dotted horizontal line represents our cutoff for significance at P < 0.00001. The shaded boxes encompass EST characterized in Table 1 that shows large, significant differences in expression between behavioral types.
