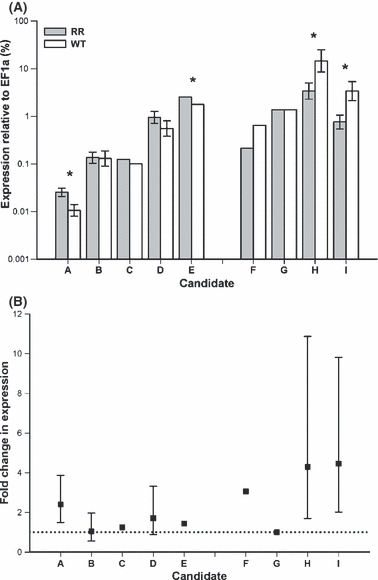
Figure 4.

Expression of candidates validated with real-time polymerase chain reaction (PCR). (A) Bars depict means in the statistical analysis conducted without Monmouth data (Table 2). However, candidates C, E, F, and G represent median values because nonparametric analyses were used and therefore error bars could not be calculated. *Significant differences in expression at P < 0.05. (B) Calculated fold change difference in expression relative to the other behavioral type. The dotted line represents no difference in expression. A–E are predicted rotation-resistant candidates; F-I are predicted wild-type candidates. For analyses and accession numbers, see Table 2.
