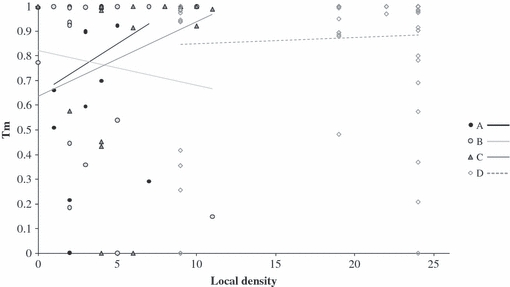
Figure 3.

Relationship between individual-level outcrossing rates (tm) and the local density measured as the number of flowering plants within a radius of 20 m around each individual within populations A, B, C and D. Correlation coefficients associated with regression lines are equal to 0.201, −0.132, 0.268 and 0.062 for population A, B, C and D respectively. Logistic regressions suggested no effect of local density on individual outcrossing rates (all at P > 0.05 with χ21 = 0.51, 0.23, 0.82 and 0.18 for population A, B, C and D respectively).
