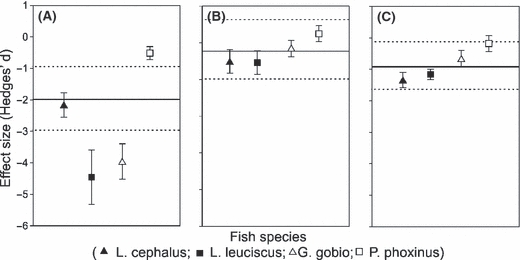
Figure 4.

Effect sizes (measured as the Hedges’d ratio) measured for each genetic indices [(A) allelic richness; (B) observed heterozygosity; (C) Fst] and for each of the four species studied independently (Leuciscus cephalus, Leuciscus leuciscus, Gobio gobio and Phoxinus phoxinus). Error bars are standard deviations. For each genetic index, the mean effect size has been summarized across species using the cumulative effect size (Ē, full horizontal lines). The 95% confidence interval around the cumulative effect size has been added (dotted horizontal lines). Low values of effect size indicate strong effects of fragmentation.
