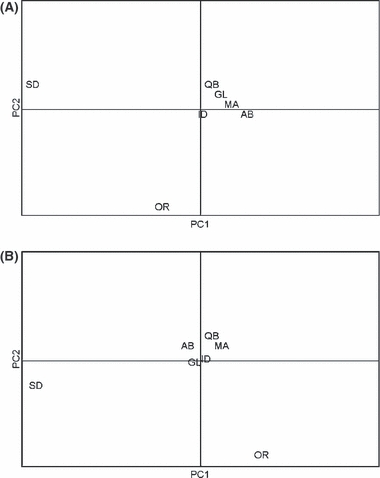
Figure 2.

Principal Components Analysis visualizing clustering of sampling locations based on (A) mtDNA; PC1 = 59%, PC2 = 39%; (B) microsatellite data, PC1 = 38%, PC2 = 29%; SD = South Dakota, OR = Oregon, ID = Idaho, MA = Missoula, GL = Glacier, AB = Alberta, QB = Quebec.
