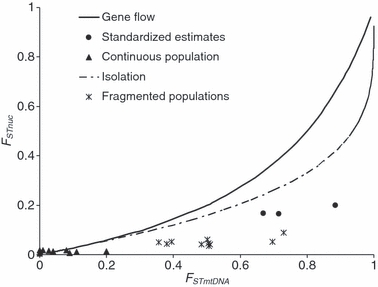
Figure 6.

The expected relationship between FSTnuc and FSTmtDNA at mutation–drift equilibrium under Wright's island model of migration (solid black line) and under a model of complete isolation (dashed line). Observed pairwise values of FSTmsat and FSTmtDNA for black-backed woodpeckers are plotted; black triangles are sites within the continuous distribution, asterisks are pairwise values where at least one of the pair are in the fragmented sites and solid black circles are standardized estimates between the three populations inferred from both hierarchical population analyses and individual-level clustering in geneland.
