
Figure 4.
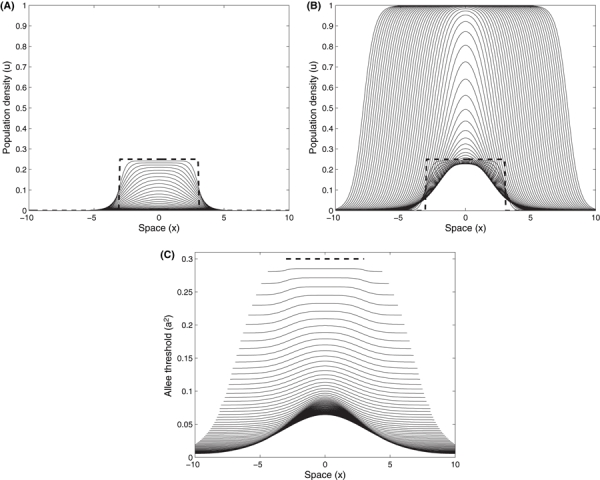
Diffusive dispersal of an introduced population at an initial density (bold dashed line) below the initial Allee threshold, a2 = 0.3 (u = 0.25, r = 1, D = 0.1) across a linear, one dimensional habitat. The population collapses over time to extinction (A) where there is no evolution (ε = 0), and succeeds (B) after an initial decline with evolution (ε = 0.02). (C) The evolution of the mean value of the Allee threshold across space (where the initial distribution is given by the bold dashed line). The population density distribution and corresponding trait values (i.e., Allee threshold) are plotted at equal time increments (every 20 of 1200 model iterations).