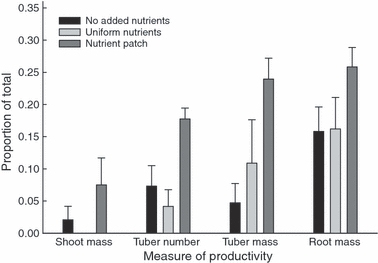
Figure 1.

Response of Cyperus esculentus to slow-release fertilizer treatments of none, distributed uniformly, or distributed as a patch, and expressed as the mean proportion (±1 SE) of the total found in the section of the plot furthest from where tubers were sown. For the patch treatment, significantly more tubers (P < 0.01), greater tuber mass (P < 0.05) and root mass (P < 0.01) were located in the resource patch section of the plot (n = 5) compared with the other two treatments.
