
Figure 2.
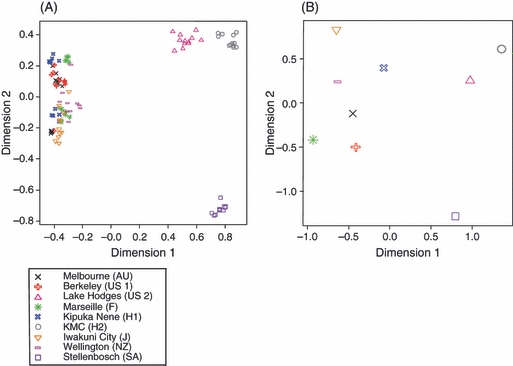
Multidimensional scaling visualization of the relationship between (A) all sampled Linepithema humile individuals based on differences in their cuticular hydrocarbon profiles (Euclidian distance), and (B) all sampled nests based on genetic distances (Nei). Distinct supercolonies are color coded; different symbols of the same color represent nesting sites within the same supercolony.