
Figure 2.
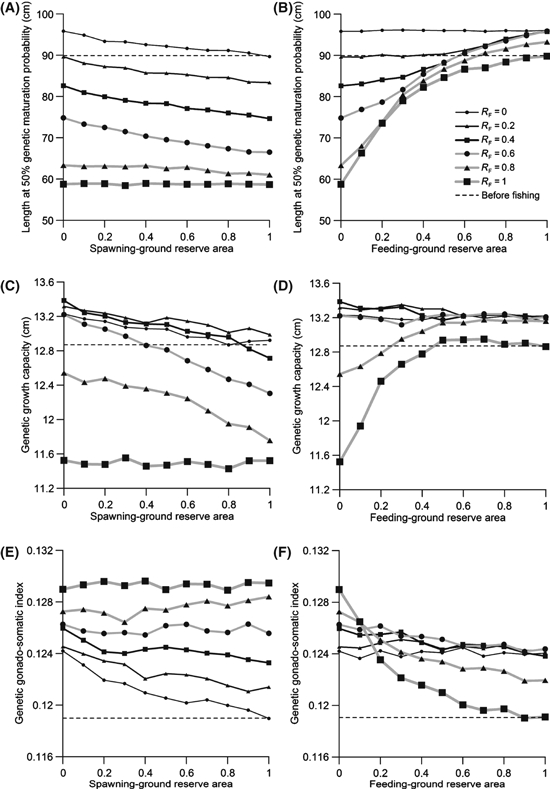
Effects of a spawning-ground reserve (left) and feeding-ground reserve (right) on fisheries-induced evolution of maturation, growth, and reproductive investment. The feeding-ground ratio RF of catches describes the fraction of the total allowable catch that is permitted in the feeding grounds as opposed to in the spawning grounds. The thickness of lines and the size of symbols increase with RF between 0 (all fishing occurs in the spawning grounds) and 1 (all fishing occurs in the feeding grounds). Fishing occurred for 100 years with an annual harvest ratio of 0.5. The length at 50% maturation probability is the midpoint of the probabilistic maturation reaction norm (PMRN) for the mean age at maturation (8 years) in the initial population, lp50,8 = iG + sG 8 years, where iG is the genetic PMRN intercept and sG is the genetic PMRN slope. The genetic growth capacity gG describes the average juvenile growth increment in the absence of density dependence. The genetic gonado-somatic index rG is the average reproductive investment in the absence of allocation shortage. The horizontal dashed line indicates the value of the trait in the year before fishing is started when the population was at an evolutionary and ecological equilibrium. Values shown are means for 30 independent model runs. The legend in panel B applies to all panels.